As Winter approaches are you wondering if you can fish the river? What is the depth, is it in flood?
Well the Environment Agency have a water level sensors along all our river stretches. The data they generate is accessible to us and we have a dedicated river levels page so you can see level before you leave home.
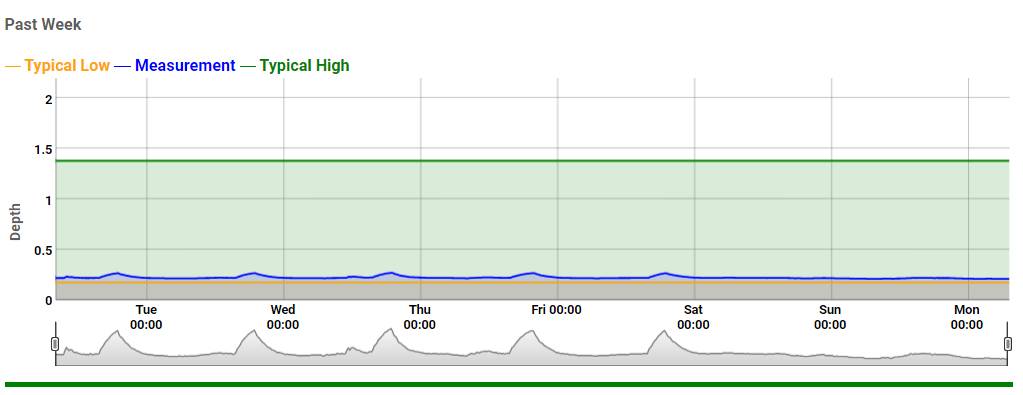
Each river stretch has some numeric data on depths and an easy to read 7 day graph.
The graph shows a low level, an actual level and a high level for that stretch.
This data is updated every 30 mins.
In addition the EA have made available the flow rates on some rivers, we all know the turbidity / cloudiness is key indicator of fish activity.
Low flow & low turbidity means the fish hide in safe spots to avoid predators.
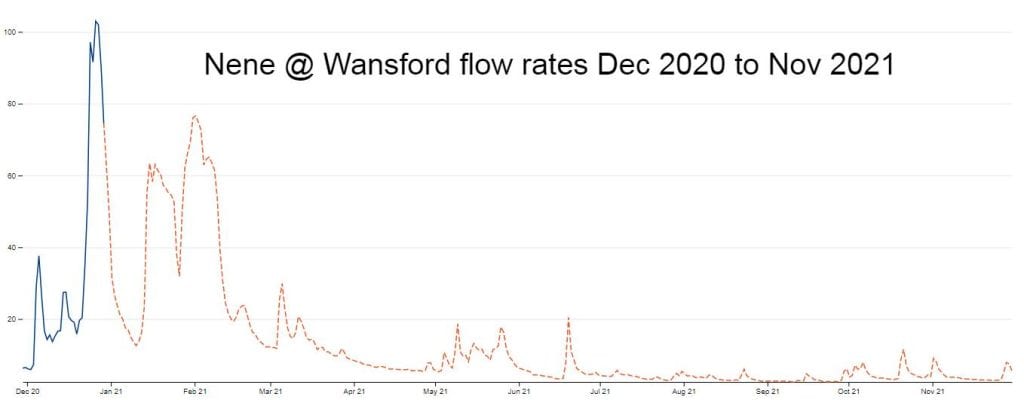
Wansford is one of the measuring stations where data is recorded and we have made in available on our web page.
An example of what you will see is
River Flow Rate
Highest Recent Flow: Dec 26th 2020 – 103 cubic m /sec
Lowest Recent Flow: July 26th 2021 – 2.9 cubic m /sec
Last few days flow rates
26-Nov-2021 – 3.09 cubic m /sec
27-Nov-2021 – 5.08 cubic m /sec
28-Nov-2021 – 7.91 cubic m /sec
29-Nov-2021 – 7.54 cubic m /sec
30-Nov-2021 – 5.59 cubic m /sec
01-Dec-2021 – 4.64 cubic m /sec
02-Dec-2021 – 4.83 cubic m /sec
You can see the flow as a graph for the last month or more by following a link.
Check the levels and flows before you go and save yourself a journey this Winter.
See the live River Levels & Flows – here